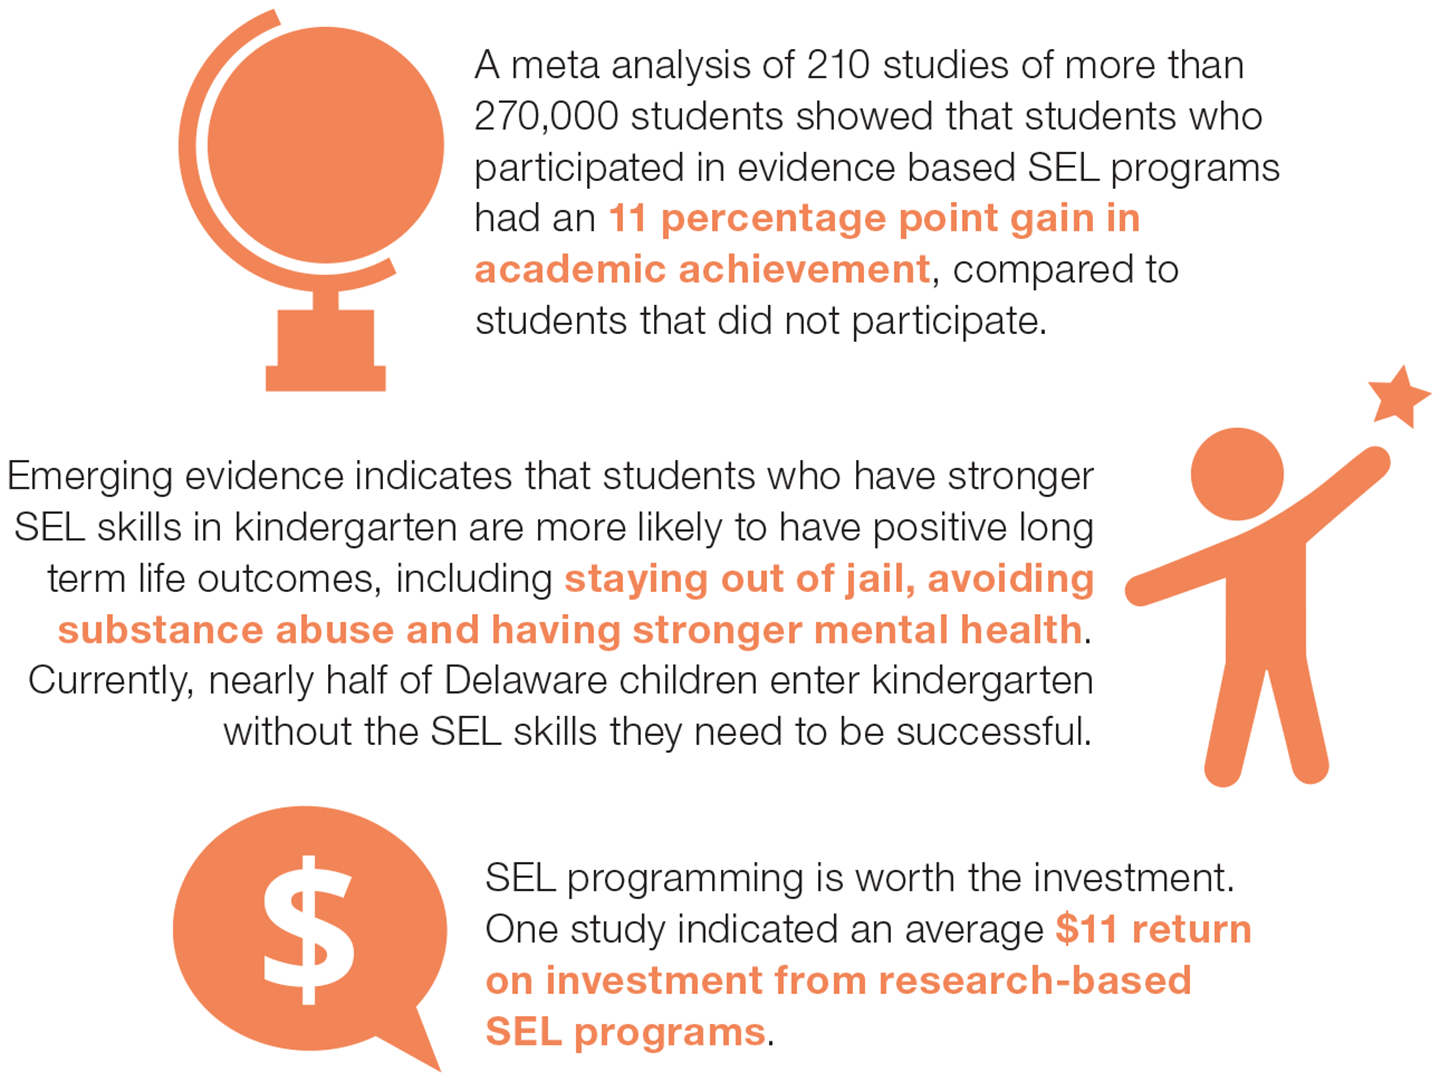
Sources: CASEL. (2017). Benefits of SEL; Belfield, C., Bowden, A.B., Klapp, A., Levin, H., Shand, R., & Zander,
S. (2015). The Economic value of social emotional learning. Journal of Benefit-Cost Analysis, Volume 6 (3),
508-544; Durlak, J. A., Weissberg, R. P., Dymnicki, A. B., Taylor, R. D., & Schellinger, K. (2011). The impact of
enhancing students’ social and emotional learning: A meta -analysis of school-based universal interventions.
Child Development, 82, 405-432; Jones, D.E., Greenberg, M., & Crowley, M. (2015). Early social-emotional
functioning and public health relationship between kindergarten social competence and future wellness.
American Journal of Public Health; Delaware Department of Education. (2017). Early learner survey results


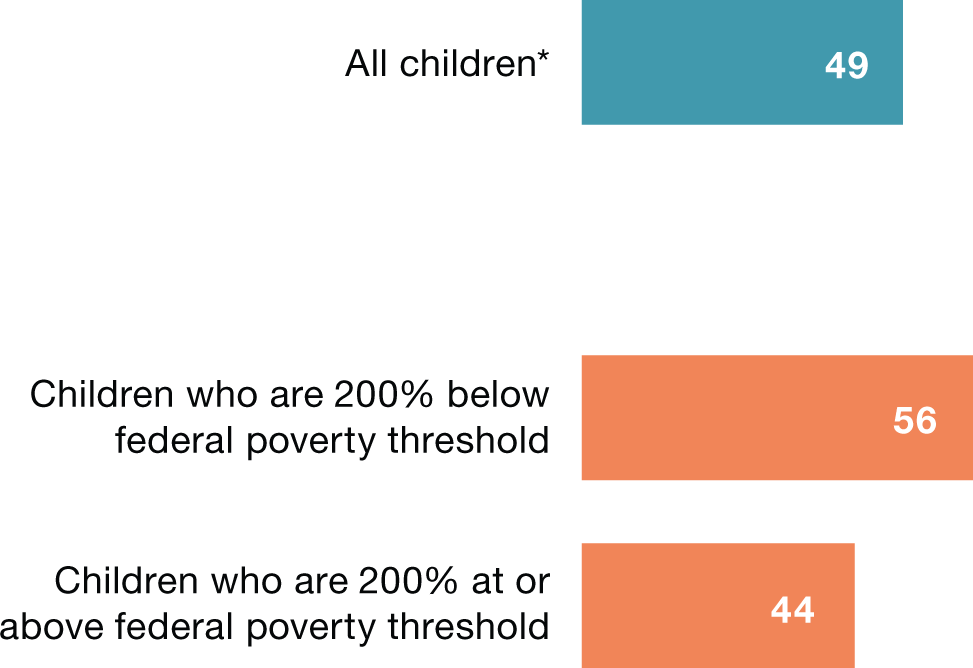
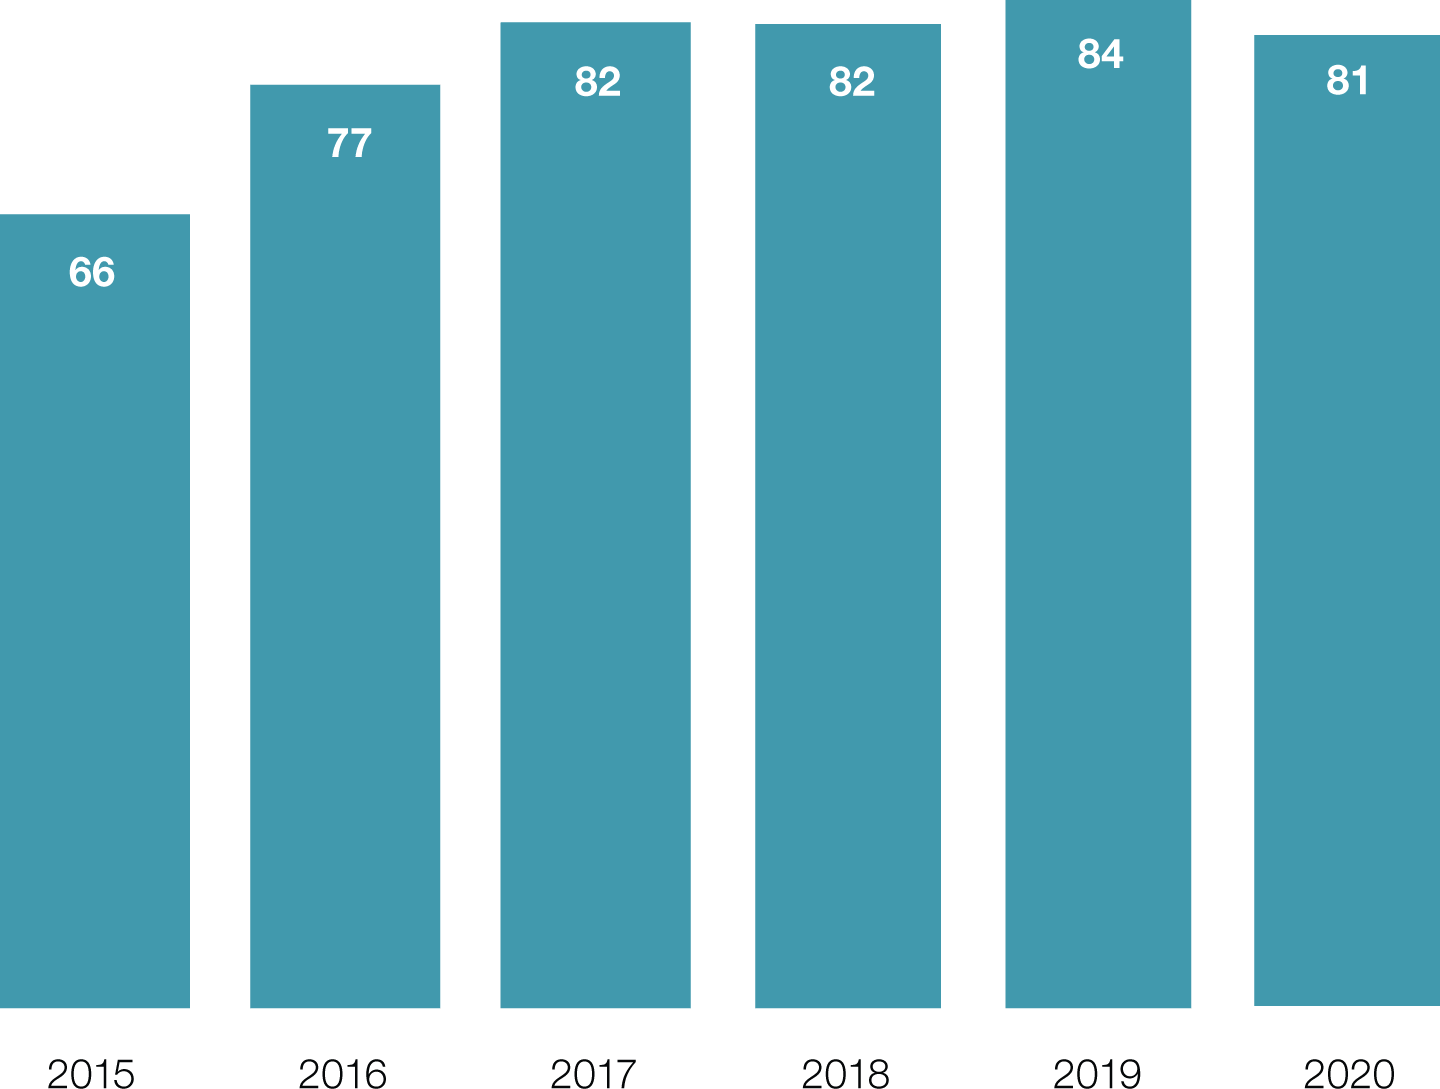
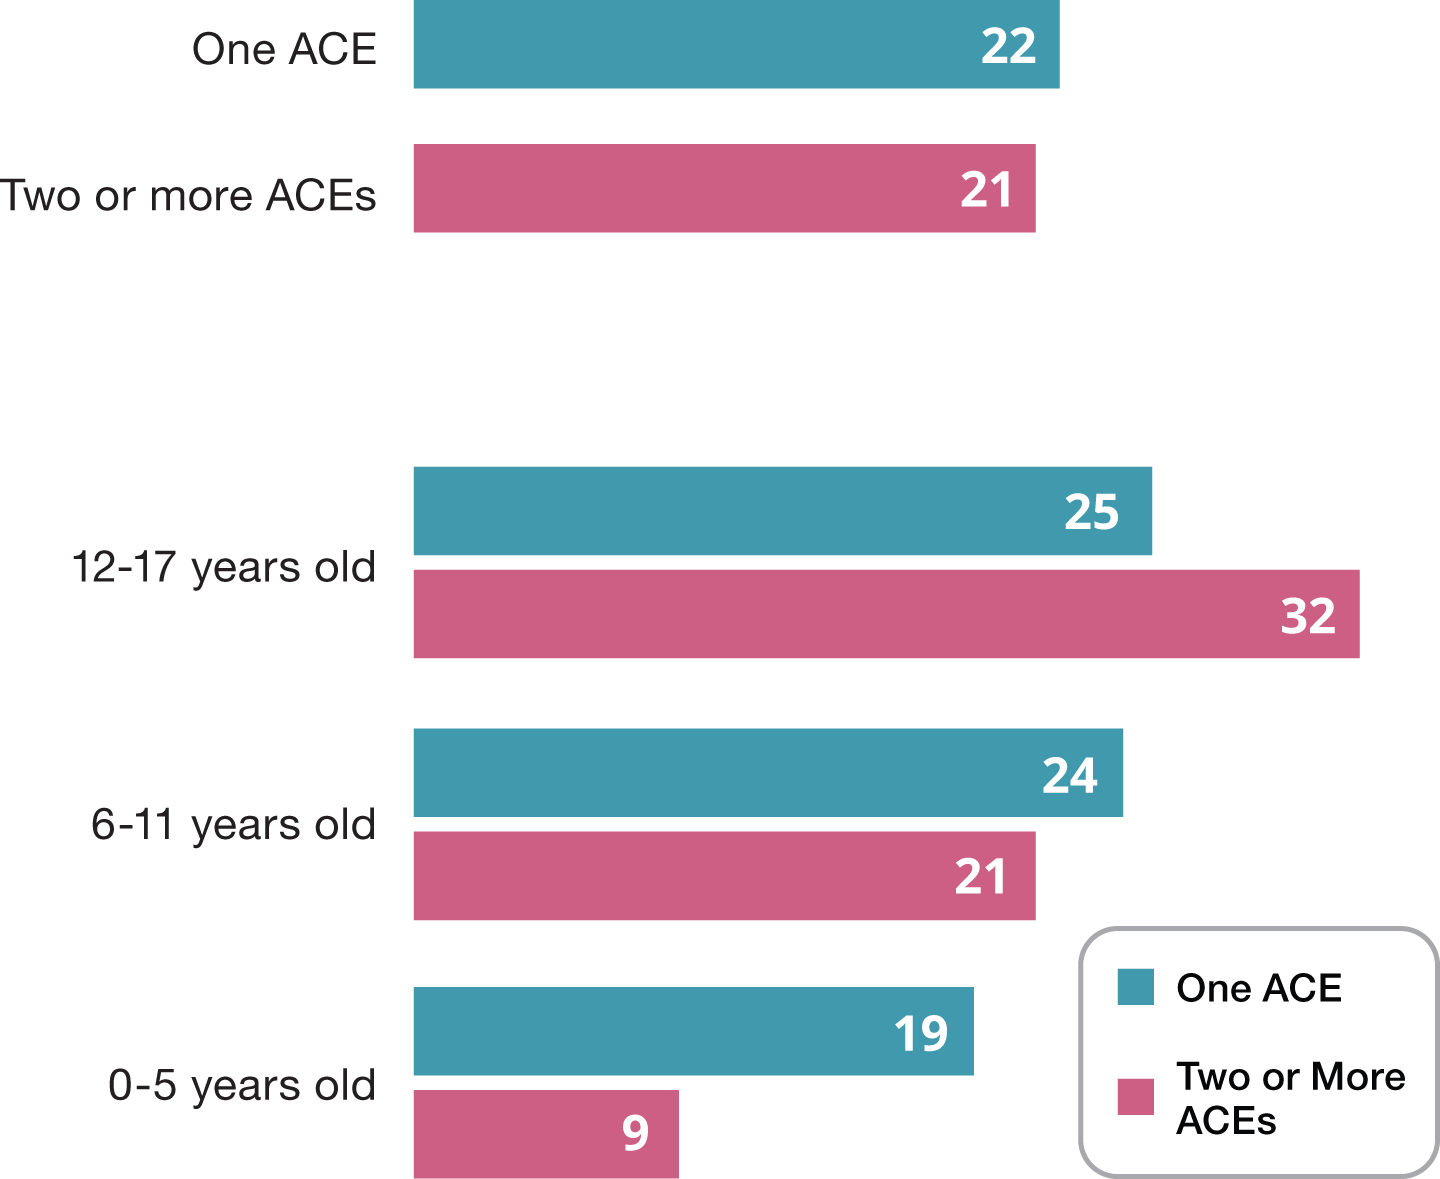 Percentage of Delaware children who’ve
experienced one or more ACEs by age group
Percentage of Delaware children who’ve
experienced one or more ACEs by age group