How the Federal Stimulus will Impact Delaware Schools

Updated on April 14, 2021 – Click here to see a charter- and district-level breakdown of stimulus dollars.

Along with the passage of the $1.9 trillion federal stimulus package that President Joe Biden signed into law last Thursday comes huge implications for the education world. While $1,400 stimulus checks (headed to around 446,105 Delaware households, according to Sen. Tom Carper) may generate the most buzz this week, we shouldn’t lose sight of what the stimulus means to our local school community.

The package will provide $350 billion for states, local governments, territories and tribal governments, with around $123 billion earmarked for K-12 schools. The legislation also includes funding for colleges and universities, transit agencies, housing aid, child care providers and food assistance.

March 2020 (Elementary and Secondary School Emergency Relief Fund) December 2020 (Coronavirus Response and Relief Supplemental Appropriations Act) March 2021 (American Rescue Plan Act)
National K-12 Allocation $13 billion $54 billion $123 billion
Delaware K-12 Allocation $43 million $183 million $411 million

The bill, known as the American Rescue Plan Act, marks an enormous uptick in K-12 funding, almost 10 times the amount included in the original stimulus. In addition to the previous two stimulus packages under the federal CARES Act in 2020, which included infusions of $13 billion last March, and another $54 billion in December, this plan has the opportunity to serve as a critical lifeline for students, educators, and families.

How Much Will Delaware Receive?

Funding for Elementary and Secondary Schools

Of the approximate $123 billion K-12 pot, Delaware is estimated to receive around $411 million. The majority of the funding, around $370 million, will go directly to local education agencies (LEAs), e.g. local districts and charter schools. Twenty percent of the funding LEAs receive must be allocated to addressing student learning loss brought about by the pandemic. The remaining 80 percent of funds LEAs receive can be spent on a wide variety of items, such as activities and programs to address the unique needs of high-need students, materials and supplies related to COVID response, educational technology, facility maintenance, and wrap-around supports for students’ mental health and social and emotional learning.

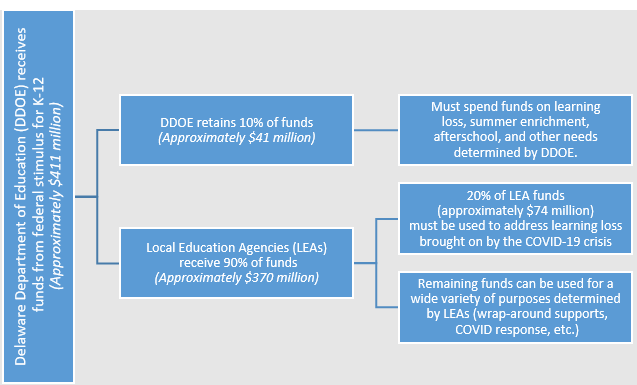
After dispersing the majority of funds (90 percent) directly to LEAs, The Delaware Department of Education must set aside the remaining dollars, which totals around $41 million. Those dollars must be allocated according to certain parameters, including addressing learning loss (five percent), summer enrichment (one percent), and other educational needs.

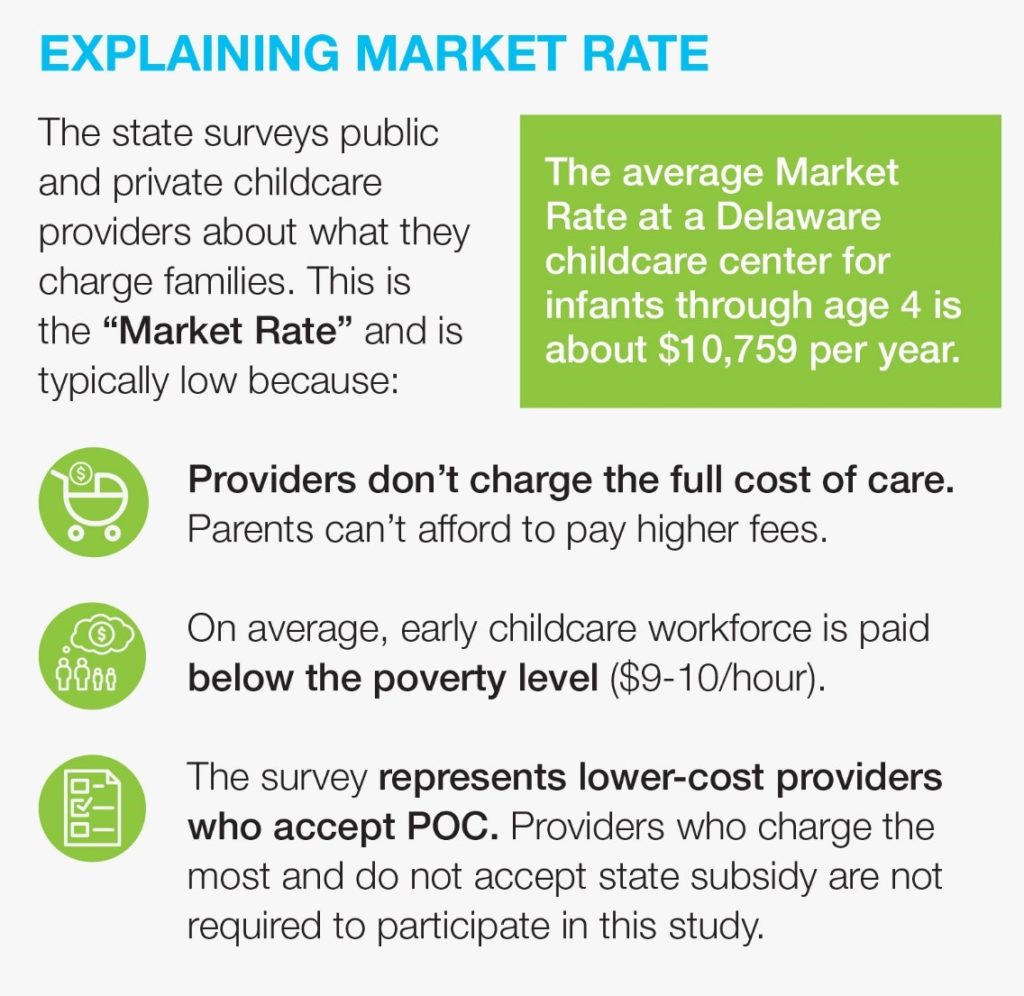
Early Child Care Crisis

Thanks to passage of the American Rescue Plan Act, the nation’s child care sector will receive around $39 billion in direct relief funding. Delaware’s child care industry should receive around $109 million of that. The funding is broken into two streams: one—$42 million—will provide expanded child care assistance (via the Child Care and Development Block Grant) to families and providers, including supporting the child care needs of essential workers. The remaining $67 million stream creates a stabilization fund for eligible child care providers, many of whom are struggling to keep their doors open.

The new stimulus also provides $1 billion in emergency funding for Head Start in order to help maintain access and services for children and their families. Delaware is estimated to receive almost $2.5 million from this for Head Start in addition to what the child care industry is expected to receive.

Other Things to Watch

State, county, and local governments will also get a huge chunk of relief funding. Projections see Delaware receiving around $1.4 billion total, with further breakdowns at the state and local governments looking like this:

State Government $913 million
City of Wilmington $55.26 million
City of Dover $6.9 million
New Castle County $108 million
Kent County $35 million
Sussex County $45 million


Those dollars could have ripples into the education space. Some of it is earmarked for housing assistance, infrastructure, capital projects, small business and nonprofit supports, and more.

For now, state officials will gather intel and guidance on how to utilize the funds. We’ll keep you updated.

Additional Resources:

The Science Behind Reading

Reading is the foundation of all schooling, as reading proficiency affects students in all subject areas each step of their academic career and well into their adult lives. Teaching students how to read, however, is complex, and has been a hot topic of debate in the education community for generations. While most agree that reading is essential, stakeholders have not always agreed on how exactly to teach students how to read. The result? Not all instructional literacy practices and methodology are rooted in the decades of research on reading, known as the science of reading.

Why is this a problem?

Research shows that students who struggle with literacy have difficulty catching up as they advance in their educational career. Three quarters of students who are poor readers in third grade remain poor readers in high school. Low literacy skills can affect students’ success outside of the classroom, as reading proficiency is a fundamental skill for the workforce and life.

National and state student proficiency in reading has remained relatively stagnant at low rates. A large number of students in elementary school (a pivotal time for learning how to read) cannot read at grade level and the gaps in reading proficiency among subgroups continue to persist at high levels nationwide.

Similar trends exist in Delaware. Only 36 percent of Delaware’s fourth grade students scored proficient or advanced on the reading portion of the National Assessment of Educational Progress (NAEP) in 2019, the only national standardized assessment of students. When looking at Delaware’s standardized assessment, the Smarter Balanced Assessment, only 51 percent of third graders score at or above grade level in English Language Arts, with gaps in achievement among racial and socioeconomic subgroups.

How did we get here?

For centuries, reading instruction was primarily based on “phonics” or the relationship between sounds and written letters. Opposition to phonics instruction grew into what is known as the “whole language” movement, which argued instruction should be based on whole words, rather than letters.

Despite emerging research on the science of reading in the mid-1900s, the debate continued, and by the 1980s the debate became widely known in education as “the reading wars.” In the early 1990s, states and schools began adopting the “whole language” method, removing phonics instruction from classrooms. By the late 1990s and early 2000s however, more research had been done on the science of reading and Congress convened a National Reading Panel to evaluate the research.

The findings of the panel showed that teaching children the relationship between letters and sounds improved reading achievement, therefore proving that phonics is essential for reading instruction. In the aftermath of the panel’s report, whole language repackaged as “balanced literacy” or what is commonly known as a mix of phonics and whole language (but some say it isn’t so clear).

Since the National Reading Panel report two decades ago, a significant amount of research has continued to come out in support of the science of reading. It’s difficult to pin a concrete definition on the science of reading. It mainly refers to the canonical body of science-backed research that explains how the human mind acquires reading skills. It combines research from many fields, including cognitive psychology, linguistics, neuroscience, and more. The research suggests there are essential skills students need to become good readers, including: phonemic awareness, phonics, vocabulary, fluency, and comprehension.

Even with the overwhelming amount of research supporting the science of reading from the past two decades and before, teacher preparation programs, curricula, professional development, certification, and other areas of education that influence classroom practices and instruction have been slow to include scientifically based reading instruction (if included at all). Without scientifically proven literacy instruction in these key components of educator preparation and development, it’s difficult for the literacy practices and instruction rooted in science to make its way to classrooms. It’s also difficult then for educators to use this research if they have not been taught or exposed to it in their preparation and/or professional development.

What’s being done about it?

Many efforts to address this issue have been in the teacher prep arena to ensure programs base their curriculum on the science of reading. The National Council on Teacher Quality (NCTQ) reports that as of 2020, over half of traditional elementary programs teach scientifically based reading instruction to pre-service teachers.[1] This is an increase since 2013 when only 35 percent of programs taught the science of reading to pre-service teachers.

More recently, the Barksdale Reading Institute launched Path Forward, an initiative to help teacher preparation programs embed the science of reading in their curriculum. Six states make up the initiative’s inaugural group and will work together (with coaches) to share strategies on how to embed scientifically based reading instruction in their curriculum and hold programs accountable for literacy outcomes.

Many states have begun to include scientifically based reading instruction in the teacher certification process, specifically for elementary school certification. In 2015, 14 states required some form of a reading instruction assessment for teacher certification. This included state-developed exams, a Foundations of Reading test, or a Praxis exam specific to teaching reading. Since then, some states have updated their requirements to include different or more reading-specific exams.

States like Ohio, Arkansas, and Connecticut require pre-service teachers seeking certification to pass a Foundations of Reading assessment – an exam rooted in the principles of the science of reading. Other states, like Maryland, West Virginia, and Alabama require aspiring teachers to take the Praxis Teaching Reading: Elementary Education exam during the certification process. The bulk of the Praxis assessment is focused on the five core skills of reading development, but includes other skills.

What about Delaware?

Similar to other states, Delaware has made progress. Teacher preparation programs at colleges across the state have implemented scientifically based reading instruction into their curriculum. NCTQ has specifically pointed to Delaware as a state that’s on the right track in this area. Delaware mandates that research and evidence-based instructional practices and components of literacy (like phonemic awareness, phonics, and vocabulary) exist in teacher preparation program curriculum, but the mandate remains general and does not specify other parameters for literacy instruction.

Delaware still has no pre-service certification exam focused on the science of reading. Current exams for teacher certification required in Delaware are too broad to accurately assess a pre-service teaching candidate’s understanding of the science of reading. Additionally, there is no state certificate offered to pre-service, early career, or experienced teachers on the science of reading.

In 2019, the Delaware Department of Education released a literacy plan that centers around four core strategic intents: standards-aligned instruction, using high-quality instructional materials, enhancing early literacy instruction, and supporting educators in their teacher preparation. The plan highlights the core components of literacy instruction, specifically in the early grades, and the need to ensure preservice teachers are aware of and trained in these components, but remains programmatic in nature. The plan provides a framework to address Delaware’s literacy challenges, but it does not address the underlying policies that could help the state make additional progress.

View the recording from the Senate Education Committee: The Science of Reading discussion from March 22, 2021

[1] The National Council on Teacher Quality typically bases their findings on a review of course and program syllabi and program websites. Some teacher preparation programs argue their methodology for evaluating programs is not comprehensive.

We Shouldn’t Depend on Market Rate Studies to Fund Early Learning

The child care industry across the nation is in dire peril. In Delaware, the situation is just as grim. Advocates are rallying around the state’s budgetary process in hopes of increasing state investments to save struggling providers.

Even before COVID-19—which caused havoc by raising costs while lowering enrollment—early child care centers were in a financial predicament.

It’s because Delaware invests less than 25 cents for every dollar per child in children ages birth-5 compared to the state investment in children in K-12—yet brain development is greatest before kindergarten. Purchase of Care (POC) is a state subsidy for child care that helps low-income parents who work, are enrolled in training or school, or have a medical need. But POC rates have been extremely low and don’t cover the actual cost of care.

One reason the POC process isn’t ideal is that it gleans its presumed costs from a flawed “market rate study” process.

Although the state was required to release a market rate study representing all child care providers’ rates, there have been challenges in accuracy and response rates. Here are just a few more reasons why they’re not ideal.

  1. Market rate surveys are based on a market that is broken.
Setting subsidy rates via market rate survey embeds the market failures in the system.P5 Fiscal Strategies
Subsidy reimbursement rates based on distorted market rates increase the gap between what it costs to provide child care and what a state pays child care programs.Bipartisan Policy Center Early Childhood Initiative
  1. Market rate surveys only report on prices charged, which can be different from the true cost.
    • Prices that child care programs charge families care are significantly lower than the estimated true cost of providing basic care and high-quality care.
    • Some prices don’t reflect other contributors to true cost, such as churches or nonprofits who loan space for free or discounted rates.
    • In low-income areas, providers receive a low subsidy rate and the price (what providers charge) must be set low, but the cost (expenses) of providing quality care is still high.
    • In Delaware, the cost of infant care is approximately 64 percent higher for an infant compared to a four-year-old. The subsidy pays only eight percent more for an infant than a four-year-old.
Market rate surveys typically reflect regional income levels, and not child care costs, which serve to keep rates lower in low-income regions and exacerbates systemic inequity.Bipartisan Policy Center Early Childhood Initiative
  1. Market rate surveys do not capture all forms of child care.
    • Market rate surveys do not include informal arrangements outside of the typical market.
    • In places where child care deserts exist (typically in rural and low-income areas), or where families need to find specialized care for various reasons, many families find alternative ways to find care for their child, such as relying on friends and family.
    • Some families may not pay for informal arrangements, but many do. For arrangements where families do pay, they are not likely to be included in a market rate survey.
    • And, a number of child care providers do not respond to the survey—including private and public schools, which are exempt from child care licensing requirements, and for profit child care centers who do not take state subsidy and are therefore disincentivized from completing the survey.
By overlooking these regional and community-level variations, using the market rate survey to set subsidy reimbursement rates may reinforce inequities in the child care market.Bipartisan Policy Center Early Childhood Initiative

 Market rate surveys use current rates to set future reimbursement rates.

    • States are required to revisit their market rate every three years, but a lot can change in three years that could influence the price (what child care providers charge families) and cost (providers’ expenses) of care. The COVID-19 pandemic is a perfect example of this. According to the Bipartisan Policy Center, components (expenses) that drive the cost of providing child care: rent and utilities, materials and administration, food, personnel (salaries and benefits).
    • And, even independent of COVID-19, costs go up about two percent per year.

So what should Delaware do?

  1. Increase child care subsidy rates to enable families to access 75 percent of child care providers, based on the 75th percentile of the market. We estimate this will cost $40 million in FY22.
  2. And, to stabilize families and providers, child care should be paid based on the enrollment, not attendance of a center, which is estimated to cost $20 million in FY22.
  3. In Delaware’s 2022-24 Child Care Development Fund Plan, which will be submitted to the federal Administration for Children and Families, Delaware should adopt the cost of quality care cost methodology adopted by Washington, D.C. and other states.

Not Counting on the Count: Why Student Count is Trickier Than You Think

Updated on March 15, 2021

School funding across the United States is determined by a series of complex, interrelated policy decisions. There has been a lot of discussion in Delaware lately about how to best allocate state dollars to schools, but little written about a seemingly small but important piece of the puzzle: how we count students. The policy for how we count students is even more important this year now that students are not occupying classroom seats like they normally would be. As we head into a new legislative session this January with important school equity issues on the table, it will be important to consider Delaware’s counting method alongside them.

In Delaware and most places, the student “count” plays an important factor in how much money gets doled out. But the method a state chooses for counting its students is a related but separate policy decision from the method a state chooses to allocate its resources. Allocation, for the most part, depends on the students being served. The student count determines the amount of funding that is allocated to schools the following school year. In Delaware’s case, school funding is translated into “units” meaning “staff units” or personnel the school is allowed to hire.

Delawareans have said they want to see a more equitable, predictable, and stable funding system—but basing our student count on attendance and limiting it to once a year holds back progress.

Delaware counts its students based on attendance once per year, usually around September 30.  But think about the inherent trappings of a snapshot of attendance taken once early in the fall. What about students who move or transfer after September 30? Or students who were absent during that September count? A more equitable, predictable, and stable count would be one that includes all students enrolled and increases the frequency of the count over the span of a school year.

Why does the count matter?

Once the student count is complete and verified by the state Department of Education, the state takes the number of students in each building and converts them into “units.” A unit is the state resources needed to support a classroom such as teachers, school personnel, energy costs, building costs, etc. Since the student count determines how we calculate units and allocate funds to schools each year, it is a critical component of the funding system. In other states, that student count gets put in to weighted student funding/foundation formula.

Why does how we count matter?

There are two major issues at play when counting students: how often we count and whether we count attendance or membership (enrollment). How often we count, or the frequency of the count, can vary between once a year, multiple times a year, or every day of the school year. The more times you count, the more equitable and accurate the count is.

Attendance is who is actually present at or during school, whereas membership means how many students are enrolled on the school’s roster. An attendance-based method increases the chances of an undercount of total students because it only includes who is present. When a district undercounts, they receive fewer units, or resources, to serve their students. Counting enrollment instead of attendance lessens the potential of an undercount because it includes all students a school serves, whether they are present the day of the count or not. Having an accurate number of all students is crucial to ensure schools receive the amount of funding needed to support all students enrolled, not just those who attend.

An enrollment-based count is more equitable for the same reason: it allows districts to count and include all students a public school serves. Black, Hispanic, English learners, low-income, and special education students are more likely than their peers to be chronically absent from school—which means they are more likely to be missed by Delaware’s current attendance-based student count. Again, an undercount of total students could mean less funding—a district receives funding for those included in the attendance-based count, not total students enrolled. Basing the count on enrollment would ensure all students are captured and that schools receive funding that supports all students enrolled.

The COVID-19 pandemic made counting student attendance in Delaware a challenge this past fall and arguably demonstrates why we need to change how we count students. Because of the pandemic, many Delaware schools delayed their start dates and had to pivot to provide virtual, hybrid, or in-person education to students. Because of the mixed-delivery system of education, school attendance has been difficult to define and capture this year. The News Journal reported that even with a delayed student count of November 13, concerns over the possibility of an undercount persisted. The November 13 student count has since come out and shows that public school enrollment dropped statewide.

What changes been proposed in Delaware?

Legislators and advocates have recognized the need to update how Delaware counts students. For instance, the 150th General Assembly considered legislation to change the student, count but it ultimately did not pass. The bill proposed Delaware’s current single day unit count system shift to a “Multiple Single Day Count” method. This change would allow school districts to participate in an optional mid-year unit count to include students who enrolled after the initial unit count was conducted in September to allow schools to qualify for additional funding. UPDATE: A new version of this bill (HB 54) has been introduced this legislative session. Similar to the previous proposal, this bill clarifies how to conduct the optional mid-year unit count and how it can be used. 

What do other states do?

All states require some form of a student count in order to fund public education. Student count methodology varies from state to state, with most states using Average Daily Membership. Neighboring states such as Maryland and New Jersey also use a Single Date Count, but then use weighted student funding to allocate resources.

What are the other methods?

Single Day Count (Delaware Method): A one-time count is the least equitable method for counting students. It does not address student transfers or new enrollment after the count is completed. If a student transfers to a different school after the count, they are not included in their new school’s actual student count. In Delaware, the single count method is also based on attendance. This means that even if a student is enrolled in a school, they will not count toward a district’s September 30 count unless they are in attendance during the count window.

Multiple Single Day Count: Adding an additional count during the school year begins to address equity and predictability, but falls short. This method addresses capturing students who have transferred schools or moved into the state, but can still lead to challenges such as inaccuracy due to the limited number of counting dates. If based on attendance, the count only captures students who are present, and not all the students a public school serves. Additionally, if based on attendance, this count can put pressure on schools to ensure students are in attendance during the count windows.

Average Daily Attendance: Research suggests that counts conducted throughout the school year are the most accurate way to capture student counts; however, basing the count on attendance, like Average Daily Attendance does, could lead to an undercount of all students that districts must serve. The frequency of the count allows for greater predictability for districts, but continues to be inequitable as it does not include all students enrolled. Potential challenges of this method include the capacity of systems to capture this information and the additional administrative burden it can create due to the frequency of counting.

Average Daily Membership: Out of the methods, Average Daily Membership is the most equitable and provides increased predictability for districts. A count based on enrollment over the span of a year allows districts to more accurately predict what their count will be and allows the count to be more stable from school year to school year. Similar to Average Daily Attendance, this method has greater accuracy because the count is conducted over the school year and not just on one day. Average Daily Membership however differs because it is based on enrollment, not attendance, making it fairer and more equitable by capturing all students a district serves.


Additional References