5 Data Takeaways from Smarter Balanced Test Scores
Earlier this week, Delaware schools made headlines as the Delaware Department of Education released the long-anticipated results of the 2015 state assessment. Here are just a few of our important data takeaways from this year’s results:
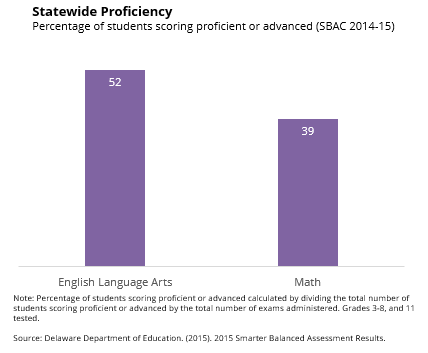
- Scores dropped as Delaware set a new baseline for student proficiency. This year’s statewide assessment results provide a new baseline for how Delaware students (grades three through eight and 11) are performing in English language arts (ELA) and mathematics. The 2015 Smarter Assessment results are the first scores for the statewide test, which is aligned with the higher Common Core academic standards. Statewide, approximately five out of 10 students are proficient in ELA, and nearly four out of 10 students are proficient in math.
- The new assessment is more than a multiple choice test. Aligned to the Common Core State Standards (CCSS), the new state assessment was designed to ensure students have the skills and knowledge they need in jobs and college. The assessment includes performance tasks and asks students to demonstrate and apply their knowledge and skills in areas like critical thinking, analytical writing, and problem solving.
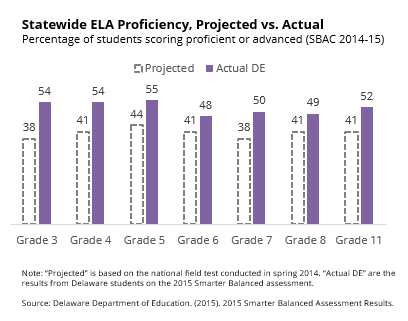
- Students performed better than expected. While this year’s scores are lower than last year’s DCAS results, Delaware students outperformed estimates (based on the 2014 national field test) in both subjects for every grade with the exception of 11th grade math.

- The statewide student participation rate was greater than 95 percent. Despite concerns about the opt-out movement’s potential impact on assessment, student participation remained strong. Among students eligible for testing in grades three through eight and 11, more than 95 percent of students participated in the smarter assessment. There was some variance across grade levels. In both subjects, participation among grades three through eight was closer to 97 percent, while participation in grade 11 was around 90 percent.
- Scores varied widely across districts and schools, highlighting the hard work of educators implementing the Common Core State Standards and schools that may need additional support. State assessment scores are one of several indicators used to gauge student performance, including: classroom assessments and grades, AP and SAT scores, and extracurricular participation. More broadly, the statewide assessment results provide families and educators a snapshot of student’s academic progress, helping identify school and student strengths, as well as areas in which they may need support.
Stay tuned for further analysis following the September 17th release of final state assessment results, which will include scores by subgroups (i.e. low-income). Until then, learn more about the Smarter Assessment and the Common Core State Standards at DelExcels.org.
Related Topics: Common Core, Delaware, opt out, SBAC, SMARTER Balanced, state testing