We Knew State and National Test Scores Would Drop. Now Let’s Get to Work.

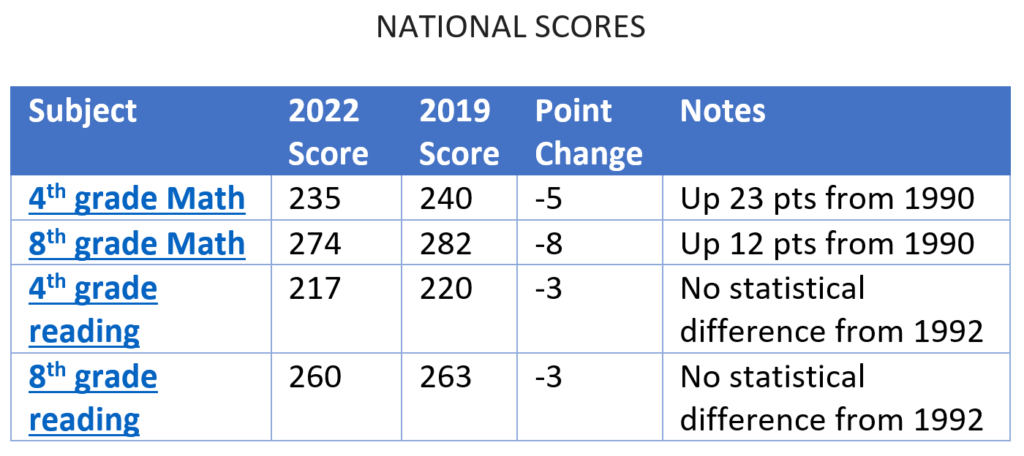
Scores from the National Assessment of Educational Progress (NAEP), a countrywide assessment for K-12 students known to insiders as the “nation’s report card,” were released earlier this week. And as observers like Future Ed have pointed out, the results paint a stark picture of the educational fallout from COVID-19.
The assessment—which captures student proficiency in math and English language arts in fourth and eighth grades—revealed “declines in every state between 2019 and 2022. In two thirds of states, proficiency rates dropped in both subjects and in both tested grades.”
Delaware wasn’t spared from the dips, with declines in all four categories. And increasing the urgency to act is that the gaps in performance that went along with race and economic standing have only expanded.


Unlike the long-term trends NAEP assessment data from earlier this year, these data points show scores are still up from where they were 20 years ago. And with the massive shifts wrought by the pandemic, including remote learning and waves of economic and health distractions at home, this outcome was expected by many. NAEP assessments also carry certain limitations, including the logistics of a fully online test that only takes place during a specific testing window. This, plus the fact that students know there are no academic implications for their performance, decreases motivation for students to do well. In addition, NAEP only shows a snapshot of student performance at a given time and does not reflect accumulated growth over the year.
As Secretary of Education, Mark Holodick told Town Square Delaware: “These scores align with what we saw in our state assessment when comparing pre-pandemic to post-pandemic assessment results,” Holodick said. “Just as the losses didn’t occur overnight, we know recovery won’t happen overnight either. But our educators, school leaders and state leaders are committed to providing supports to help students accelerate their learning and make up for lost learning during the pandemic.”
The question is: Now what? As we wrote last month, this could be an opportunity to double down in a few key areas, from investing in early learning and real-world experience through career pathways.
The good news is that we know some elements of our national strategy were working. As Education Next and others point out, performance nationally on NAEP was moving up over the last decade-plus.
But the results affirm what teachers have been telling us the last few years: that we need to do more to support our students in the wake of COVID-19, especially in math and reading. Delaware has committed to improving literacy in recent years, including developing a statewide literacy plan, and has a math plan under development. The state has focused resources on getting high-quality resources and training to educators.
Significant investments of ARP funds and state funds are being directed to learning acceleration to address these score gaps.
Several outlets have shared out best practices on math instruction, which can be leveraged to improve outcomes for students in this learning recovery period. The National Council of Teachers of Mathematics recommends encouraging math discourse and leveraging student thinking by posing purposeful questions. EdWeek also outlines some best practices as it relates to teaching mathematics that also promote student-led math exploration and discovery.
We saw this coming. As “Good to Great” author Jim Collins would say, we have seen the “brutal facts.” It’s time to double down on our efforts to achieve our collective vision of equity and excellence for all our public school students.
. . .
Notes:
NAEP reports results using widely accepted statistical standards; findings are reported based on a statistical significance level set at 0.5. Only those difference that are found to be statistically significant are referred to as “higher” or “lower.”
Math Assessment Sample: Representative samples of students from across the nation participated in the 2022 mathematics assessment as follows: 116,200 fourth-graders from 5,780 schools and 111,000 eighth-graders from 5,190 schools.
Reading Assessment Sample: Representative samples of students from across the nation participated in the assessment as follows: 108,200 fourth-graders from 5,780 schools and 111,300 eighth-graders from 5,190 schools.
Both assessments were administered digitally to the above samples.
Related Topics: assessments, data, Delaware education, delaware schools, delaware test scores, learning, NAEP